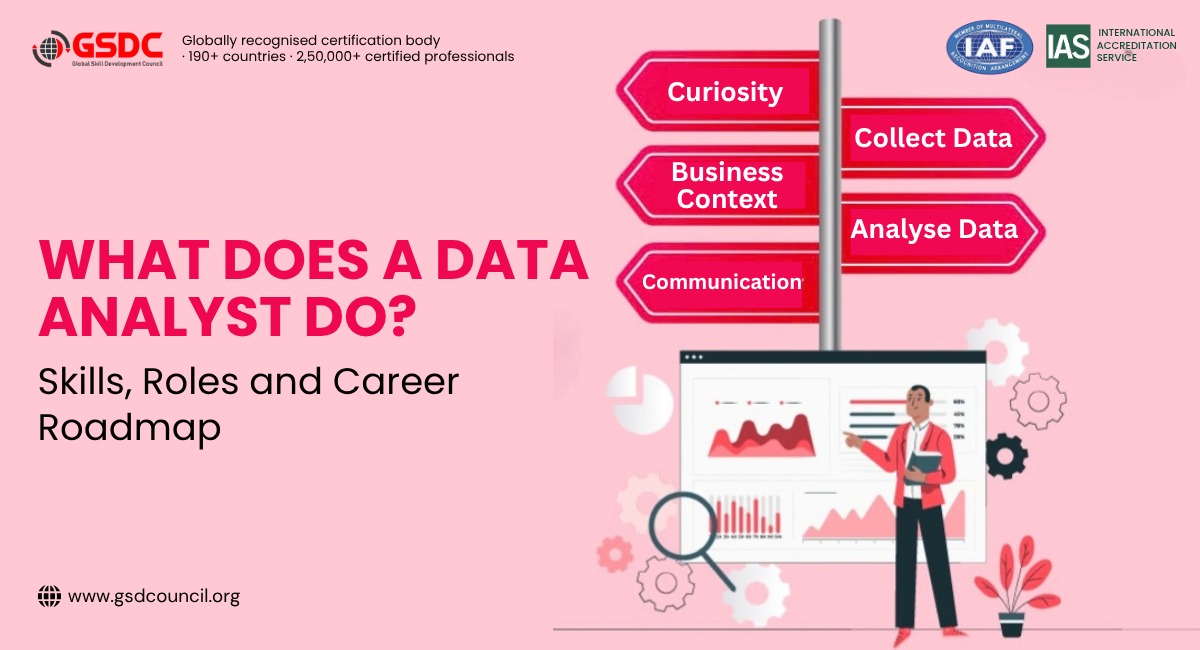
What Does a Data Analyst Do? Skills, Roles and Career Roadmap
Written by Emily Hilton
- What Is a Data Analyst?
- What a Data Analyst Might Work on in a Real Week
- Data Analyst Roles and Responsibilities
- A Sample Data Analyst Job Description
- Skills Required for a Data Analyst
- Data Analyst Skills in 2026: What Is Changing?
- Popular Data Analytics Tools
- Types of Data Analytics
- How to Become a Data Analyst: A Practical Roadmap
- Building a Data Analyst Resume That Gets Noticed
- Common Data Analyst Interview Questions
- Turning Skills Into Job-Ready Capability
- Final Thoughts
Every company you can think of is sitting on more data than it knows what to do with. Someone has to turn that pile of numbers into decisions people can actually act on. That makes data analysis an increasingly visible career path for people who enjoy working with numbers but also want to solve practical business problems.
If you are trying to figure out what is a data analyst, whether it is the right career move, or how to get from where you are now to your first analyst job, this guide covers it end to end.
What Is a Data Analyst?
A data analyst is someone who collects, cleans, and studies data to answer specific business questions and help teams make better decisions. Instead of guessing why sales dipped last quarter or which marketing channel actually works, a data analyst pulls the numbers, looks for patterns, and explains what they mean in plain language.
The role sits at the intersection of statistics, business thinking, and communication. You do not need to be a mathematician, but you do need to be comfortable with numbers, curious about why things happen, and able to explain findings to people who do not think in spreadsheets. It sits close to the wider data science field, with a fair amount of overlap in the tools and thinking involved.
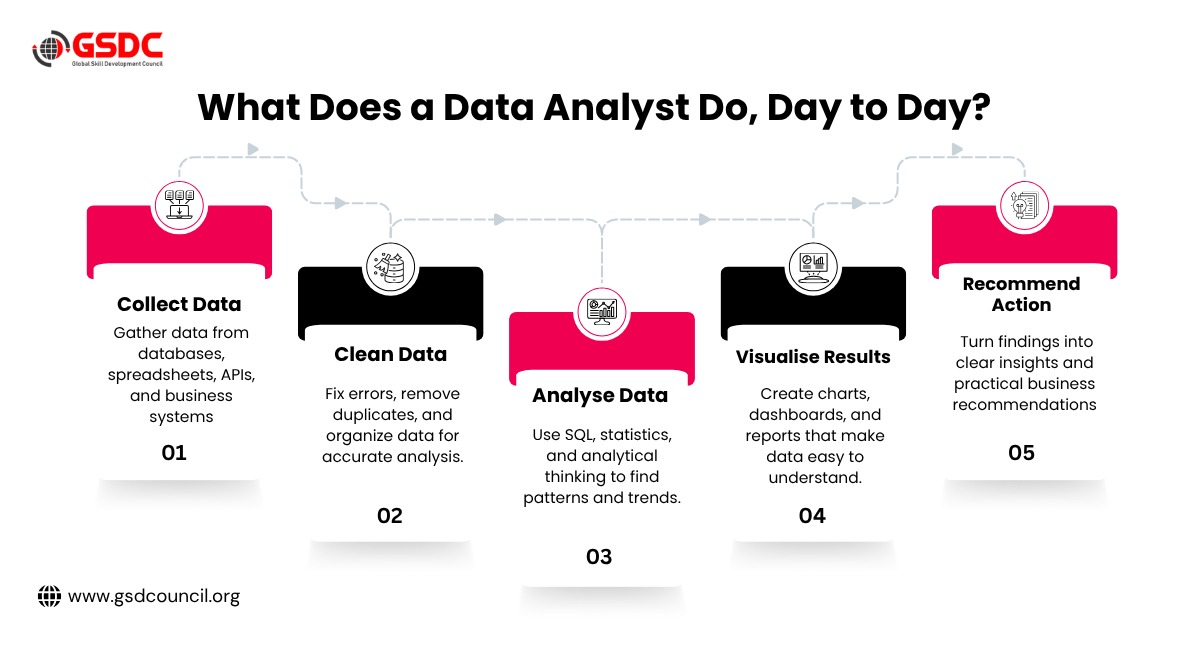
So what does a data analyst do once they are actually in the job? The daily work varies by industry, but most data analysts spend their time on a mix of the following:
- Pulling data from databases, spreadsheets, or company systems
- Cleaning messy or incomplete data so it is actually usable
- Running queries and calculations to spot trends
- Building dashboards and reports for teams to monitor
- Presenting findings to managers or stakeholders in meetings
- Answering ad hoc questions like "why did this number change"
A good chunk of the job, more than people expect going in, is cleaning and organising data before any real analysis even starts. Analysts often say this eats up a large share of a typical week.
What a Data Analyst Might Work on in a Real Week
To make this less abstract, here is a realistic stretch of five days for a mid-level analyst on a product or marketing team:
- Monday: Pull sales data from the last two weeks and check for gaps or duplicate records before anything else.
- Tuesday: Dig into why conversion rates dropped on one channel, comparing this week against the same period last month.
- Wednesday: Build or update a dashboard so the team can track the metric going forward without asking you every time.
- Thursday: Meet with the marketing team to walk through the findings and answer questions about what the numbers do and do not show.
- Friday: Automate a recurring report that used to be manual, and write up a short summary of the week's analysis for anyone who missed the meeting.
No two weeks look identical, but this is roughly the rhythm most analysts settle into: pull, question, build, explain, repeat. It is also why learning data analytics is not just about knowing individual tools. A Data Analytics Certification can help bring skills like SQL, data cleaning, visualisation, and analysis together through a more structured learning path, especially if you are building those skills from scratch.
Data Analyst Roles and Responsibilities
Talk to ten companies and you will get ten slightly different takes on data analyst roles and responsibilities, but a few core duties show up almost everywhere.
Core data analyst responsibilities usually include:
- Gathering data from multiple sources and formats
- Validating data quality and flagging inconsistencies
- Identifying trends, patterns, and outliers
- Creating visualisations and dashboards for non-technical audiences
- Writing clear summaries that connect data to business impact
- Collaborating with product, marketing, finance, or operations teams
- Recommending next steps based on what the data shows
At GSDC, this broader view of data analytics is reflected in how the field is approached: not just learning individual tools, but understanding how data is cleaned, analysed, interpreted, and turned into useful business decisions.
A Sample Data Analyst Job Description
If you are writing or reviewing a data analyst job description, here is roughly what a solid one looks like.
Role summary: We are looking for a data analyst to collect, interpret, and communicate insights from business data, supporting decision-making across departments.
Key responsibilities:
- Analyse large datasets to identify trends and opportunities
- Build and maintain dashboards using tools such as Power BI or Tableau
- Partner with cross-functional teams to define reporting needs
- Present findings clearly to both technical and non-technical stakeholders
Requirements: Proficiency in SQL and Excel, familiarity with a visualisation tool, strong attention to detail, and the ability to explain data insights without drowning people in jargon.
If you are on the hiring side, keep the requirements realistic. A lot of job descriptions ask for five tools and three years of experience for what is genuinely an entry-level position, and it scares off good candidates who would have picked things up fast on the job.
Skills Required for a Data Analyst
This is the part everyone actually wants to know: what are the skills required for a data analyst, and which ones matter most, alongside how they compare to the skills expected of a data scientist if you end up moving further into the field later.
Data Analyst Skills Required in 2026
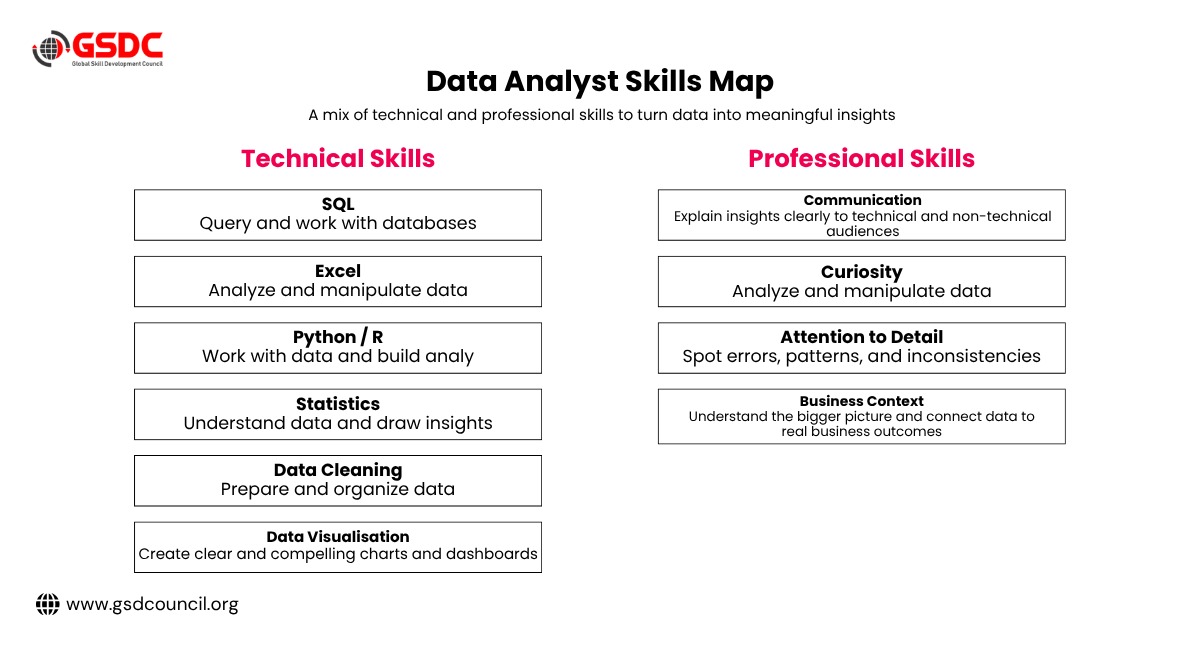
- SQL – One of the clearest entry points into data analyst roles. A recent analysis of over 65,000 data analyst job posts found SQL required in 61 percent of listings and mentioned in 71 percent overall, ahead of every other single skill. You need it to pull and shape data from databases.
- Excel – Still widely used for quick calculations, data cleaning, analysis, and stakeholder-friendly reports.
- Data visualisation tools – Power BI, Tableau, or Looker are commonly used to turn analysis into dashboards and reports.
- Python or R – Python shows up in close to half of postings, split fairly evenly between required and preferred. Not always mandatory for entry-level roles, but increasingly expected for statistical analysis and automation.
- Statistics fundamentals – Understanding averages, distributions, correlation versus causation, and basic hypothesis testing.
- Data cleaning – Knowing how to spot and fix duplicate records, missing values, and formatting inconsistencies.
Soft skills required for data analyst roles
- Clear written and verbal communication, since a brilliant analysis nobody understands is worthless
- Curiosity and a habit of asking "why" instead of stopping at the first answer
- Attention to detail, because one wrong join or filter can quietly skew an entire report
- Business context, so you understand which numbers actually matter to the people you are presenting to
Data Analyst Skills Checklist
Use this as a quick self-check before you start applying:
- [ ] Comfortable writing SQL queries with joins and aggregations
- [ ] Can build a clean dashboard in at least one BI tool
- [ ] Understand basic statistics well enough to explain them simply
- [ ] Have built at least one end-to-end project using real or public data
[ ] Can walk someone through your findings without reading off a script
Data Analyst Skills in 2026: What Is Changing?
The core skill set has not been thrown out and replaced. What has shifted is how much of the routine work now runs through AI, and what that means for where human judgment adds the most value. Alteryx's own 2026 research, based on a survey of 700 data analysts and 700 IT leaders conducted by Coleman Parkes, found that 82 percent of analysts say automation is making them more effective by helping them work faster and focus on higher-value tasks. The same research found that 85 percent of analysts report AI-generated insights now influence business-critical decisions at their organisation, and 65 percent say AI and agent-based systems work best when the underlying logic stays managed at the business level rather than handed fully to IT.
A few specific areas are where that shift shows up most:
- AI-assisted SQL and analysis - Writing a first-draft query or exploratory script with an AI assistant, then refining it, is becoming a normal part of the workflow rather than a shortcut people hide.
- Data quality and validation - As more of the first pass gets automated, someone still has to catch when a join is wrong or a filter drops rows it should not. That verification step is landing more squarely on analysts.
- AI output verification - The same logic applies to AI-generated summaries and charts. Analysts are expected to sanity-check numbers an AI model produces before they go into a report, not take them at face value.
- Automation - Repetitive reporting tasks, weekly dashboard refreshes, recurring exports, are increasingly scripted or templated rather than rebuilt by hand each time.
- Data storytelling - Turning a chart into a decision a non-technical stakeholder can act on is becoming a bigger differentiator than knowing one more tool.
- Business and domain knowledge - Understanding the industry you are analysing, not just the dataset, is what lets an analyst flag when a number looks technically correct but practically wrong.
- Working with modern data platforms - Cloud-based warehouses and BI platforms with built-in AI features are becoming standard in mid-size and larger companies, so comfort with at least one is increasingly assumed rather than a bonus.
Analysts who can combine technical skills with strong verification, communication, and business judgment can bring more value to teams as AI takes on more routine analytical work.
Popular Data Analytics Tools
You do not need to learn every tool on the market, but familiarity with a few from each category goes a long way.
Category | Common tools |
Querying and databases | SQL, MySQL, PostgreSQL |
Spreadsheets | Excel, Google Sheets |
Visualisation | Tableau, Power BI, Looker |
Programming | Python, R |
Statistical analysis | SPSS, Python libraries like pandas |
Big data | Apache Spark, Hadoop (mainly for larger, data-heavy teams) |
You do not need to learn every tool on this list. Focus on the tools that appear most often in the roles and industries you are targeting, and how they fit into the wider data science toolkit as your needs grow.
Types of Data Analytics
Understanding the different types of data analytics helps you talk about your work with more precision, and it often comes up in interviews too.
- Descriptive analytics – What happened. Summarising past data, like monthly sales totals.
- Diagnostic analytics – Why it happened. Digging into the causes behind a trend or anomaly.
- Predictive analytics – What is likely to happen next. Using historical patterns to forecast outcomes.
- Prescriptive analytics – What to do about it. Recommending specific actions based on the data.
Most entry-level and mid-level data analyst roles live mainly in the descriptive and diagnostic categories, with predictive and prescriptive work usually handled by more senior analysts or data scientists working on real-world projects that pull all four types together.
How to Become a Data Analyst: A Practical Roadmap
If you are wondering how to become a data analyst without a data science degree, the good news is that a notable share of postings do not require one at all. In 365 Data Science's analysis of 1,000 data analyst job listings, 18.4 percent did not specify a required degree level, and statistics, computer science, and mathematics led the pack among the postings that did. Here is a realistic data analyst roadmap.
- Learn the fundamentals - Start with Excel and basic statistics before jumping into anything complex.
- Get comfortable with SQL - It is one of the most consistently requested skills across data analyst postings, making it a strong place to focus early in your learning journey.
- Pick up one visualisation tool - Power BI or Tableau both have solid free learning paths.
- Build two or three real projects - Use public datasets, analyse something you are genuinely curious about, and document your process.
- Add Python if you have time - It is not always mandatory early on, but it widens your options fast.
- Create a portfolio - A simple site or GitHub repo showing your projects does more for your credibility than another certificate alone.
- Apply broadly and iterate - Use interview feedback to figure out which skill gaps keep coming up, then close them.
The timeline depends on your starting point, the time you can dedicate each week, and the depth of projects you build. Consistent practice matters more than trying to rush through every tool at once.
Building a Data Analyst Resume That Gets Noticed
A data analyst resume lives or dies on specifics. Recruiters skim fast, and vague lines do not survive that skim.
Weak: "Responsible for analysing data and creating reports." Stronger: "Built a weekly sales dashboard in Power BI that cut manual reporting time by 6 hours a week and was adopted by three regional teams."
Data Analyst Skills for Your Resume
- List tools by proficiency, not just by name, so it is clear what you can actually do
- Quantify outcomes wherever possible, time saved, revenue impact, accuracy improved
- Include one or two personal or academic projects if your work experience is thin
- Keep it to one page unless you have several years of relevant experience
Common Data Analyst Interview Questions
Expect a mix of technical and behavioural questions. Some of the most common data analyst interview questions include:
- Walk me through a project where your analysis changed a decision.
- Write a SQL query to find duplicate records in a table.
- How do you handle missing or inconsistent data?
- What is the difference between correlation and causation?
- How would you explain a complex finding to someone non-technical?
- Tell me about a time your analysis was wrong. What did you learn?
Practice explaining your reasoning out loud, not just producing the right answer, since interviewers are usually testing how you think as much as what you actually know.
Turning Skills Into Job-Ready Capability
Everything above, the SQL practice, the projects, the resume rewrite, and the mock interview answers, adds up to real capability, but it can still feel scattered when it is self-directed. Knowing individual tools is not quite the same as knowing how to combine them in a real business context, which is where structured learning can be useful.
This is where a structured program can help close the distance faster than trial and error alone. The Global Skill Development Council (GSDC) offers a Data Analytics Certification built around practical, job-relevant skills rather than just theory, covering data cleaning, analysis, and decision-making frameworks that map closely to what shows up in real job descriptions. For anyone who has been learning piecemeal from scattered tutorials, it is a way to pull that knowledge into something structured and recognised.

Final Thoughts
The data analyst role is changing, but the fundamentals still matter. SQL, visualisation, statistics, and communication remain important. What is changing is what analysts do with those skills. AI can help produce the first query, chart, or summary, but someone still needs to decide whether the question is right, whether the data is reliable, and what the result actually means.

Related Certifications
Frequently Asked Questions
A data analyst is someone who studies data to answer business questions and help teams make informed decisions, usually through reports, dashboards, and clear written summaries.
A degree can be helpful, but it is not universally required. Requirements vary by employer and role, and some job postings do not specify a degree requirement at all.
SQL is a strong starting point, followed by Excel and one visualisation tool. Together, they give beginners a practical foundation for many entry-level analyst roles.
There is no fixed timeline. It depends on your starting point, how much time you can dedicate each week, and how deep your practice projects go. Steady, consistent effort tends to matter more than the total calendar time.
Stay up-to-date with the latest news, trends, and resources in GSDC
If you like this read then make sure to check out our previous blogs: Cracking Onboarding Challenges: Fresher Success Unveiled
Not sure which certification to pursue? Our advisors will help you decide!