Kirkpatrick Model: Measure Training ROI and Business Impact
Written by Emily Hilton
- What Is the Kirkpatrick Model?
- The Four Levels, Explained Simply
- What a Training Evaluation Dashboard Should Actually Track
- Why Corporate Training ROI Is So Hard to Prove - and How to Do It Anyway
- Common Training Evaluation Methods Worth Using
- Building an L&D Analytics Practice That Leadership Trusts
- Careers Behind the Numbers: L&D as a Growing Profession
- Where the Profession Is Headed
- Bringing It All Together
Ask any L&D leader what keeps them up at night, and you'll hear some version of the same worry: "We ran the training. People showed up, filled the feedback form, gave it four stars. But did anything actually change?"
That question is exactly why the Kirkpatrick Model of training evaluation has survived for close to seven decades and is still the go-to framework in corporate learning today. It doesn't just tell you whether people liked a session - it tells you whether the business got its money's worth.
In this blog, we'll break down the model level by level, look at real benchmark data, and show you how to build a simple training evaluation system that leadership will actually trust.
What Is the Kirkpatrick Model?
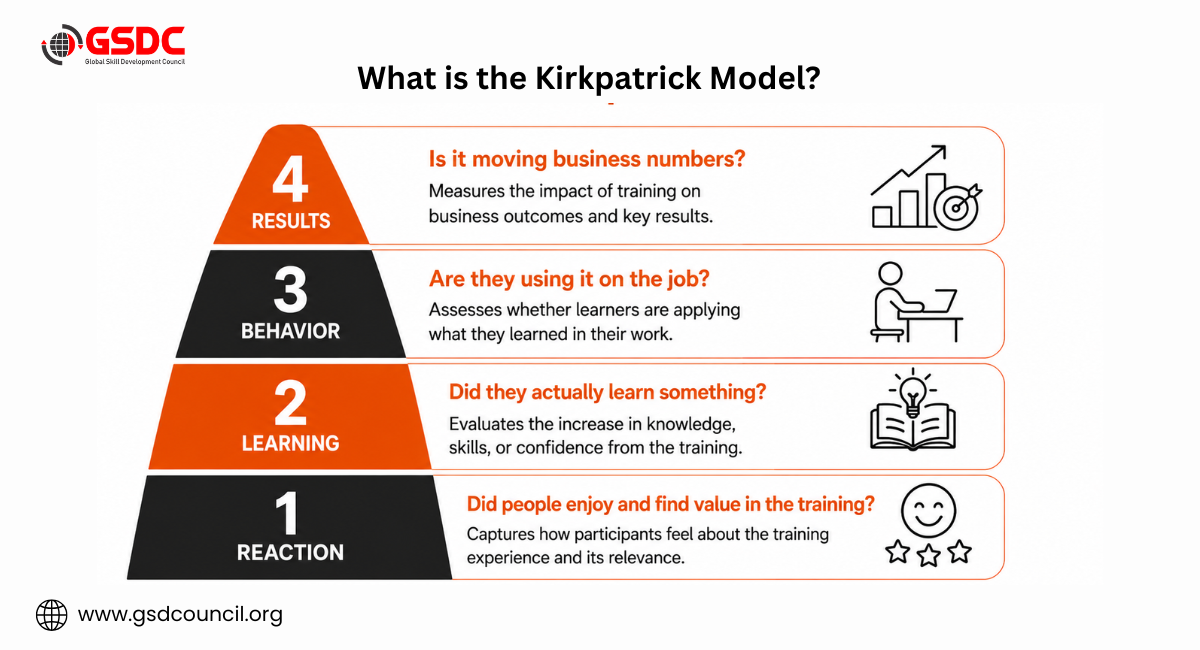
The Kirkpatrick learning model is a four-level framework for evaluating how effective a training program really is. It was developed by Donald Kirkpatrick, who first outlined the idea in his 1954 doctoral dissertation and later published it as a series of articles in 1959. Decades on, it remains the most widely used training evaluation framework in workplace learning.
At its core, the model asks four increasingly difficult questions:
- Did people enjoy and find value in the training? (Reaction)
- Did they actually learn something? (Learning)
- Are they using it on the job? (Behavior)
- Is it moving business numbers? (Results)
Each level builds on the one before it, and each is progressively harder - and more valuable - to measure. Most organisations comfortably measure Level 1. Very few make it all the way to Level 4, which is exactly where the real business case for training lives.
The Four Levels, Explained Simply
Level 1 - Reaction
This is the "smile sheet" stage: short surveys asking whether the training felt relevant, engaging, and well-paced. It's the easiest data to collect, which is why almost every organisation collects it - and why it's often over-relied on.
The one thing worth remembering here: relevance predicts behaviour change far better than enjoyment does. A learner can rate a session five stars and still never use a word of it back at their desk. So instead of asking "Did you enjoy this?", ask "Could you apply this to your actual job?"
Level 2 - Learning
This level checks whether knowledge, skills, or confidence actually shifted. Quizzes, role-plays, scenario-based assessments, and pre-vs-post tests all live here.
A useful add-on that modern practitioners have layered onto the original model: measuring learner confidence and commitment, not just correct answers. Someone might ace a quiz and still walk away with zero intention of changing how they work. Asking "How confident are you that you'll use this next week?" catches that gap early.
Level 3 - Behavior
This is where most training programs quietly fail - not because the content was bad, but because nobody checked whether it stuck. Level 3 looks at whether people are genuinely applying what they learned once they're back at their desks, on the shop floor, or on a sales call.
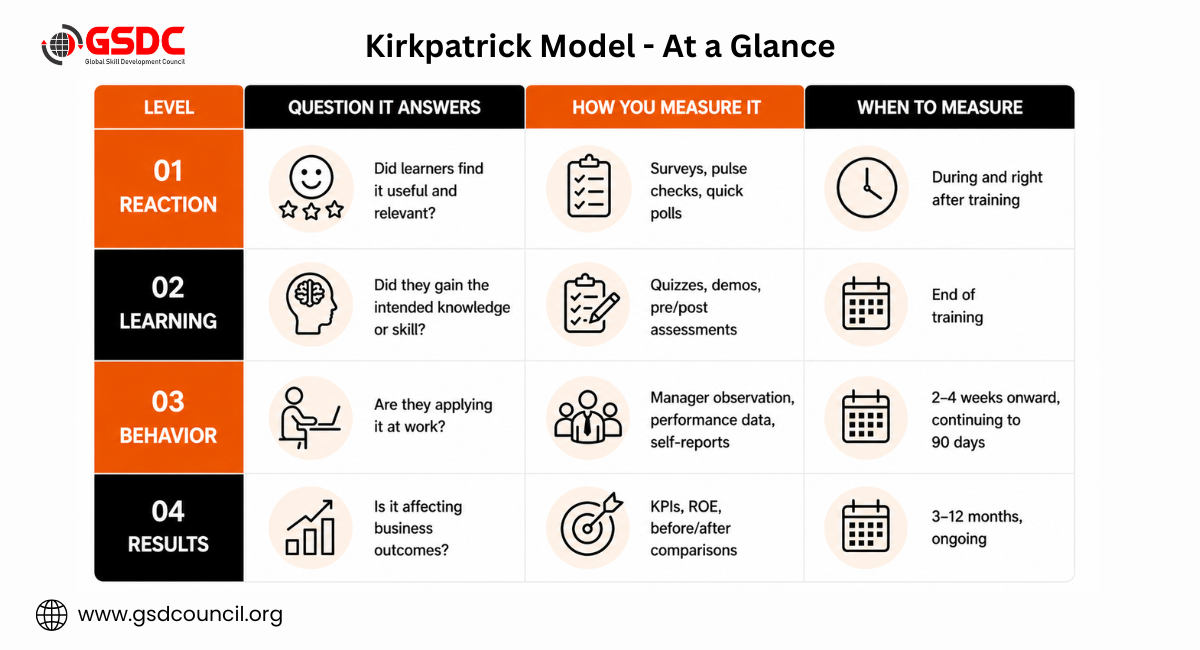
Practical benchmark: start observing behaviour within two to four weeks of training, and keep checking through the 30/60/90-day window. Wait longer than that and it becomes nearly impossible to separate "the training worked" from "everything else that happened at work that quarter."
Level 4 - Results
This is the level that gets training a seat at the leadership table. It connects learning to outcomes the business actually cares about - sales growth, faster onboarding, fewer errors, better customer satisfaction, lower attrition.
One honest caveat worth knowing: pinning an exact dollar figure on training's contribution is genuinely hard, because too many other factors move business results at the same time. That's why many practitioners now favour Return on Expectations (ROE) - did the training deliver what stakeholders agreed success would look like - over chasing a single, hard-to-defend ROI percentage.
This is also the level where L&D teams tend to feel out of their depth connecting learning data to business KPIs isn't a skill most trainers pick up on the job. It's a big part of why structured programs like GSDC's L&D Analytics & Metrics Professional Certification have gained traction: they're built specifically around this gap, turning Level 4 from a vague aspiration into a skill you can actually apply.
This is also the level where L&D teams tend to feel out of their depth, connecting learning data to business KPIs isn't a skill most trainers pick up on the job. It's a big part of why structured programs like the Certified L&D Analytics & Metrics Professional certification have gained traction: they're built specifically around this gap, turning Level 4 from a vague aspiration into a skill you can actually apply.
What a Training Evaluation Dashboard Should Actually Track
It helps to see what a fully connected set of training metrics looks like in practice, level by level. The table below is an illustrative example, not a verified industry-wide study, put together in a Disprz analysis to show what each level's data might realistically look like once you're tracking it properly:
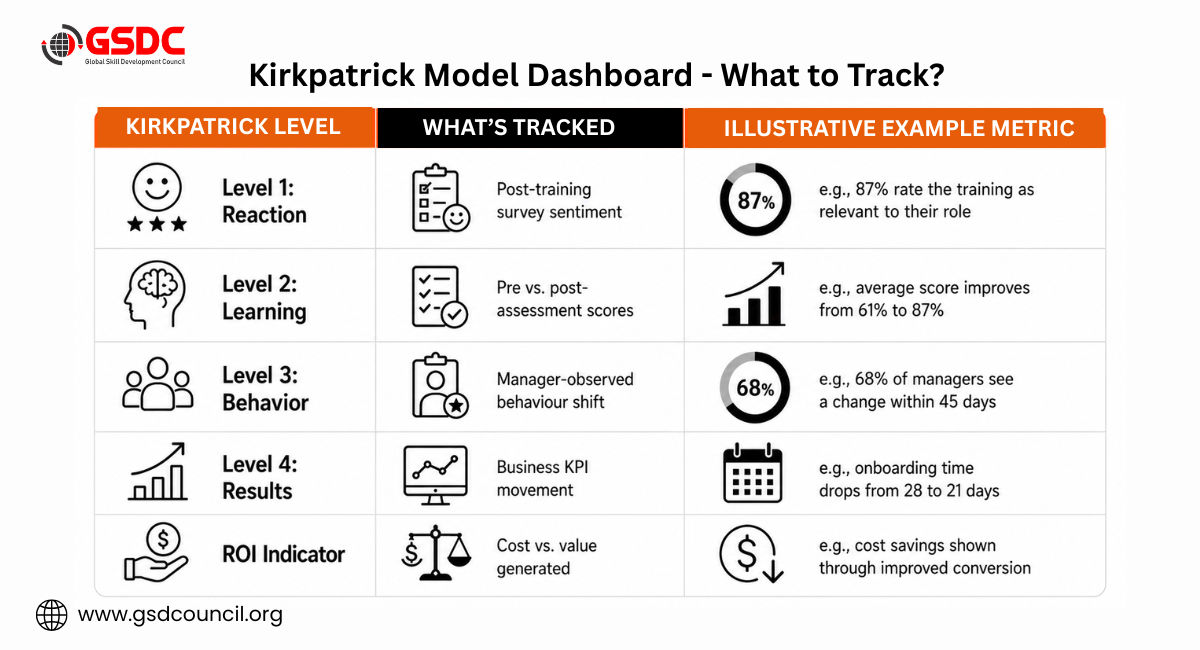
The specific numbers will differ for every organisation; what matters is the structure: a learning and development metrics dashboard worth building tracks all four levels together, not completion rates in isolation. That connected view, run consistently over time with your own data, is what turns an L&D report into evidence leadership can act on. It's the same principle that organisations like the Global Skill Development Council (GSDC) encourage L&D professionals to build toward measurement that's connected across all four levels, not just a completion rate on a spreadsheet.
Why Corporate Training ROI Is So Hard to Prove - and How to Do It Anyway
Every CFO conversation about the training budget eventually lands on the same question: what did we get back for this? Calculating a precise corporate training ROI figure is difficult because business results are shaped by dozens of factors beyond the training itself - market conditions, seasonality, management changes, and more.
Two more honest, defensible alternatives have become standard practice:
- Return on Expectations (ROE): Did the program deliver what stakeholders defined as success at the outset? This is agreed upon before the training launches, not backfilled afterward.
- Contributive ROI: An acknowledgment that training is one contributing factor among several, rather than the sole cause of a business result.
If you're trying to build a credible case for the roi of employee training, start with a control-group comparison where possible, or at minimum a clean "before vs. after" window. Pair that with a plain-language business story - "new-hire productivity rose 22% within 45 days of the redesigned onboarding" lands with leadership far better than a spreadsheet ever will.
Common Training Evaluation Methods Worth Using
Beyond surveys and quizzes, here are practical training evaluation methods that organisations are leaning on more heavily today:
- Pre- and post-assessments to isolate the actual knowledge gain, not just the final score
- Manager observation checklists for on-the-job behaviour, reviewed at 30, 60, and 90 days
- System-generated behaviour data pulled from CRM, helpdesk, or field tools - for example, whether reps are actually using a new sales script
- Control-group or pilot comparisons where one team gets the training and another doesn't, to isolate impact
- Stakeholder check-ins against pre-agreed success criteria, rather than a single end-of-project report
The common thread across all of these: plan your evaluation before the training launches, not after. Waiting until the program ends to think about how you'll measure it means losing your baseline data - and losing credibility with the people funding the program.
Building an L&D Analytics Practice That Leadership Trusts
Getting from scattered survey results to a genuine l&d analytics capability takes a few deliberate steps:
- Start from the business outcome, not the course. Define what success looks like at Level 4 first, then design backward through Levels 3, 2, and 1.
- Involve managers early. They're your best source of Level 3 data - they see behaviour change (or the lack of it) up close, every day.
- Automate what you can. Pulse surveys, LMS completion data, and CRM-linked behaviour tracking remove the manual burden of chasing numbers.
- Connect the levels instead of reporting them separately. A weak Level 3 result often explains a disappointing Level 4 outcome - and a strong Level 1 score tells you almost nothing on its own about whether behaviour will actually change.
Report on a cadence, not a one-off. Measure at 30, 60, and 90 days, and look for trends across quarters rather than a single snapshot.
A Quick Word on the Kirkpatrick Model's Limits
No framework is perfect, and it's worth knowing where this one gets criticised. The assumption that a positive Level 1 reaction naturally leads to Level 2 learning, which leads to Level 3 behaviour, which leads to Level 4 results, is weaker in practice than the model implies. A great feedback score tells you almost nothing about whether someone will change how they work. The model also doesn't fully account for the work environment - training can be excellent and still fail to produce behaviour change if managers don't reinforce it or the right systems aren't in place.
- None of that makes the model less useful. It just means it works best paired with strong instructional design and genuine manager involvement, not used as a standalone checklist.
Careers Behind the Numbers: L&D as a Growing Profession
As evaluation becomes more central to L&D, the profession itself is growing more specialised. Organisations aren't just hiring trainers anymore - they're hiring people who can read data and connect it to business outcomes.
A few of the roles now in demand:
- L&D analyst jobs, focused on pulling data across LMS, HRIS, and performance systems to build the kind of dashboards described above
- L&D specialist roles, which typically blend instructional design, stakeholder management, and evaluation planning - a l&d specialist job description today usually asks for comfort with both content design and data
- Broader l&d skills in demand: needs analysis, evaluation design, facilitation, data storytelling, and increasingly, familiarity with AI-powered learning platforms
On compensation, l&d specialist salary ranges vary widely by country, industry, and seniority, so it's worth checking current listings on regional job boards for figures specific to your market rather than relying on a single global number.
If you're building a career in this space, fluency in the Kirkpatrick Model isn't optional anymore - it's often the first thing interviewers ask about.
Where the Profession Is Headed
The shift described throughout this blog from tracking attendance to proving impact isn't happening in isolation. It reflects a broader change in how the L&D profession is being asked to operate, with data literacy and evaluation skills now sitting alongside instructional design as core competencies.
Bodies like the Global Skill Development Council (GSDC) have emerged in response to exactly this shift, working to set clearer, more consistent standards for what "skilled" looks like across L&D roles globally, including the evaluation and analytics capability this article has walked through. As more organisations expect L&D to speak the language of ROE, ROI, and business KPIs, having a recognised, standardised way to demonstrate that capability matters more than it used to, both for individuals building a career in this space and for teams trying to hire for it.

Bringing It All Together
The Kirkpatrick Model isn't a form you fill out after a workshop. Used properly, it's a planning discipline: define the business result you need, work backward to the behaviour that drives it, then the learning and experience that builds that behaviour. Do that, and your learning impact conversations stop being a guessing game and start being a business case.
If you're looking to build this capability formally - whether you're an L&D professional wanting to move into analytics and evaluation, or a manager who needs your team to speak the language of ROI and ROE with confidence - a structured certification is often the fastest way to get there. The Global Skill Development Council offers programs designed to take L&D professionals from running training sessions to running a measurement practice that leadership actually trusts.

Related Certifications
Frequently Asked Questions
Reaction (how learners felt about the training), Learning (what they gained), Behavior (whether they apply it at work), and Results (the business impact it produces).
Completion tells you someone attended. The Kirkpatrick Model tells you whether the training changed what they know, what they do, and what the business achieves - a completely different, and far more useful, story.
Levels 1 and 2 can usually be measured immediately with most LMS tools. Levels 3 and 4 need a longer runway - typically 30 to 90 days for behaviour, and 3 to 12 months for measurable business results.
No. You can start with structured surveys, a simple spreadsheet for pre/post scores, and a recurring check-in with managers at 30/60/90 days. Dashboards and automation help you scale it later, but they're not a prerequisite to start.
Stay up-to-date with the latest news, trends, and resources in GSDC
If you like this read then make sure to check out our previous blogs: Cracking Onboarding Challenges: Fresher Success Unveiled
Not sure which certification to pursue? Our advisors will help you decide!