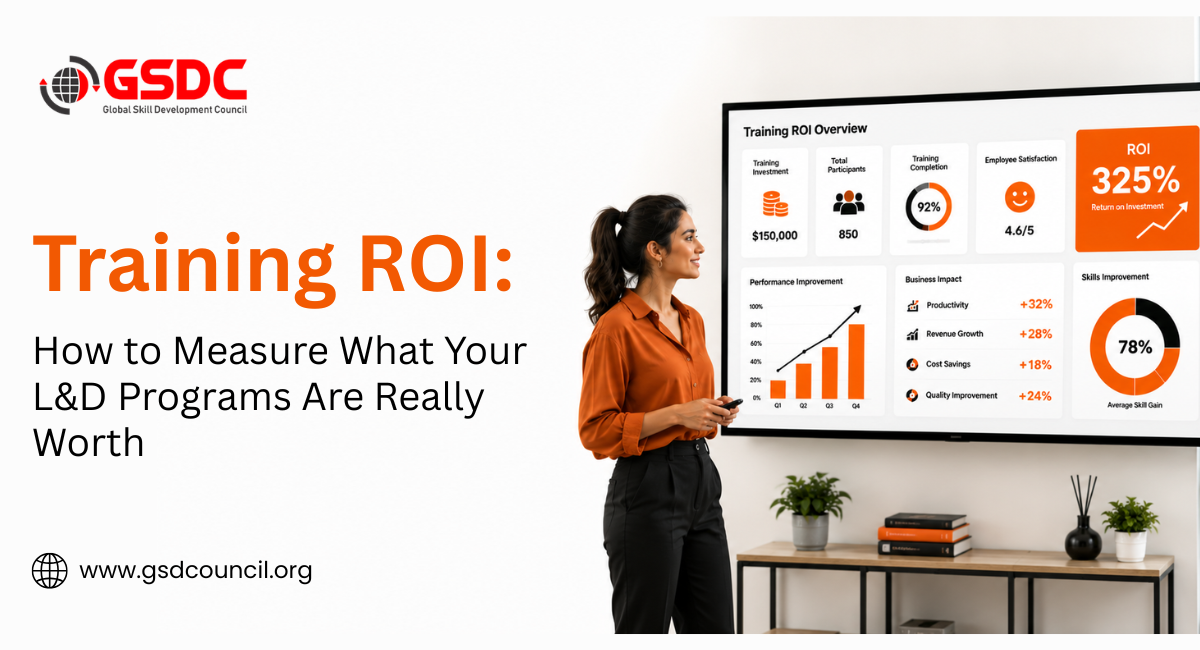
Training ROI: How to Measure What Your L&D Programs Are Really Worth
Written by Matthew Hale
- Why Learning and Development Metrics Matter More Than Ever
- The Real Reason Most L&D Teams Can't Prove ROI
- The Frameworks Behind Training ROI: Kirkpatrick and Phillips
- How to Measure ROI of a Training Program (Step-by-Step)
- Corporate Training ROI: Different Programs Need Different Math
- Learning Analytics and AI in Learning and Development
- Building an L&D Strategy Around ROI
- Build This as a Career Skill: Certified L&D Analytics & Metrics Professional
- Conclusion
Every year, U.S. companies pour billions into employee training. Yet when it's time to defend that budget in front of leadership, most L&D teams freeze up. They have attendance sheets. They have completion percentages. What they don't have is a straight answer to the one question every CFO eventually asks: "What did we actually get for this money?"
That gap - between spending on training and proving its value is - exactly why training ROI has become one of the most searched, most debated topics in corporate learning. This blog breaks it down in plain language: what to measure, how to calculate it, and how to build a learning and development strategy that leadership actually trusts.
Completion rates measure activity. ROI measures business impact.
Why Learning and Development Metrics Matter More Than Ever
L&D budgets are no longer a "nice to have" line item. They're being scrutinized the same way marketing or sales spend is. And the data shows most teams aren't ready for that scrutiny.
Deloitte research on learning analytics found that 95% of L&D organizations don't excel at using data to connect learning with business objectives, and 69% say they lack the skills to link learning outcomes to real business results. That's not a small gap; it means the vast majority of training departments are running on instinct rather than learning and development metrics that hold up in a budget meeting.
This is where learning analytics comes in. Instead of just asking "did people finish the course," modern L&D teams are asking "did the business change because of it?" That single shift - from activity to impact - is the foundation of everything else in this article.
The Real Reason Most L&D Teams Can't Prove ROI
The problem usually isn't a lack of data. Most L&D teams already have plenty of it - completions, scores, hours logged. The real problem is that they collect learning data while executives care about business data. Until those two systems connect, ROI stays impossible to prove, no matter how many dashboards you build.
This shows up in two predictable stages:
- Stage 1 thinking: Reporting completion rates and quiz scores as if they equal success.
- Stage 2 thinking: Reporting logins and time-on-platform as "engagement," without asking whether behavior actually changed.
Both feel productive. Neither answers the question leadership is really asking. A 95% completion rate only confirms people clicked through the modules - not that they retained anything, applied it on the job, or moved a single business metric. This is often called the "vanity metric" trap, and it's the single biggest reason training budgets get cut first when times get tough.
The fix isn't more dashboards. It's connecting training data to outcomes that already matter to the business - retention, productivity, error rates, sales performance, or safety incidents. A simple way to visualize that chain:
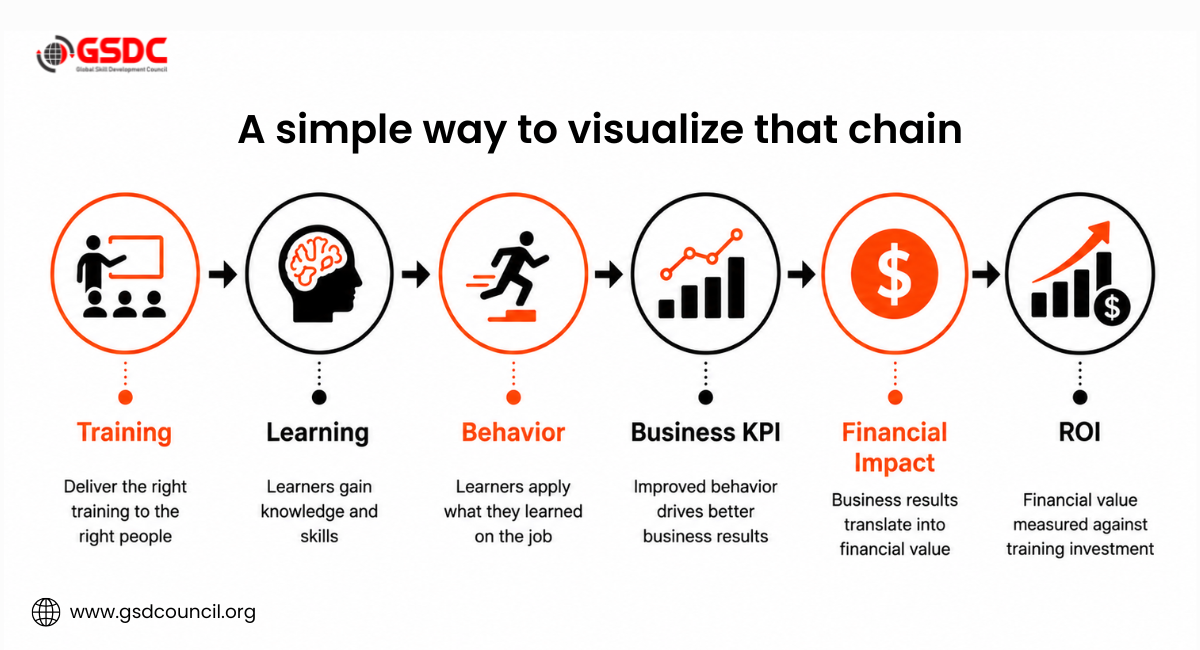
Most organizations can report on the first box. Very few can trace the line all the way to the last one - and that last box is what leadership actually funds.
The Frameworks Behind Training ROI: Kirkpatrick and Phillips
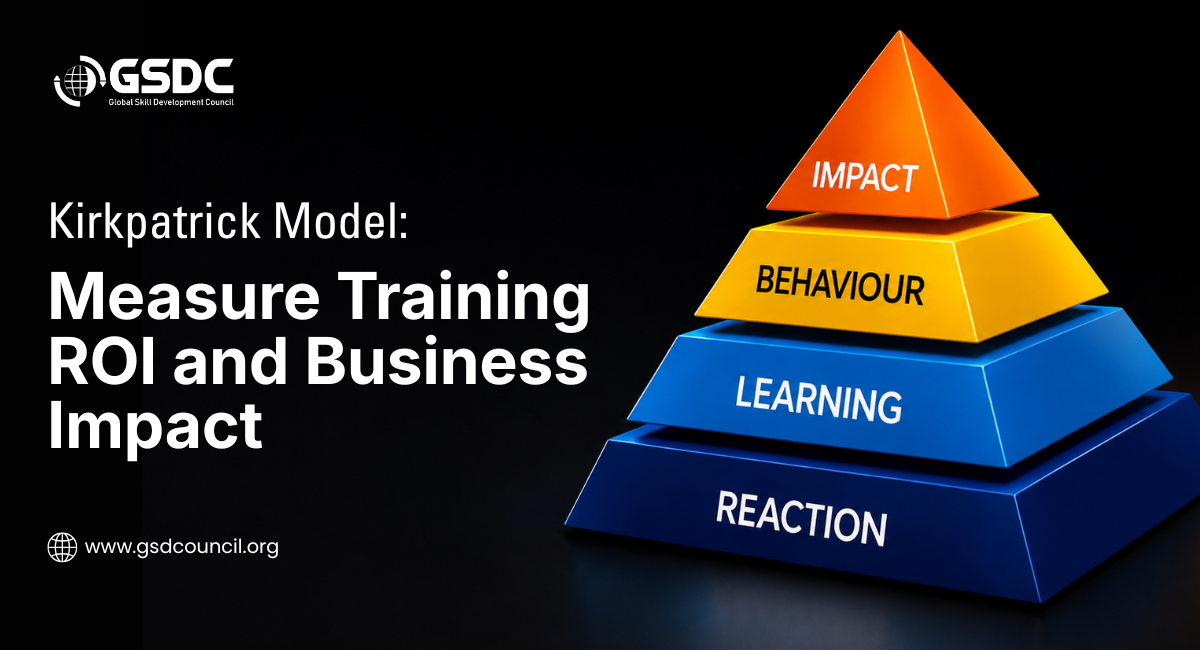
You don't need to invent a measurement system from scratch. Most organizations evaluate training using the Kirkpatrick Model, which measures four levels: reaction (did learners like it), learning (did they gain knowledge or skill), behavior (did they apply it on the job), and results (did it move a business outcome).
Jack Phillips later extended this into the Phillips ROI Methodology by adding a fifth level - ROI itself - which converts the "results" level into a financial return, isolating the effect of training from other factors and expressing it as a percentage. If you only remember one thing from either framework, remember this: Levels 1 and 2 tell you if people liked and understood the training. Levels 3 through 5 tell you if it actually mattered.
How to Measure ROI of a Training Program (Step-by-Step)
At its core, every ROI calculation answers one question: did the value created exceed the investment made? If you're wondering how to measure roi of training program initiatives without a data science team, the good news is the core formula is simple. The hard part is gathering clean numbers.
The classic ROI formula:
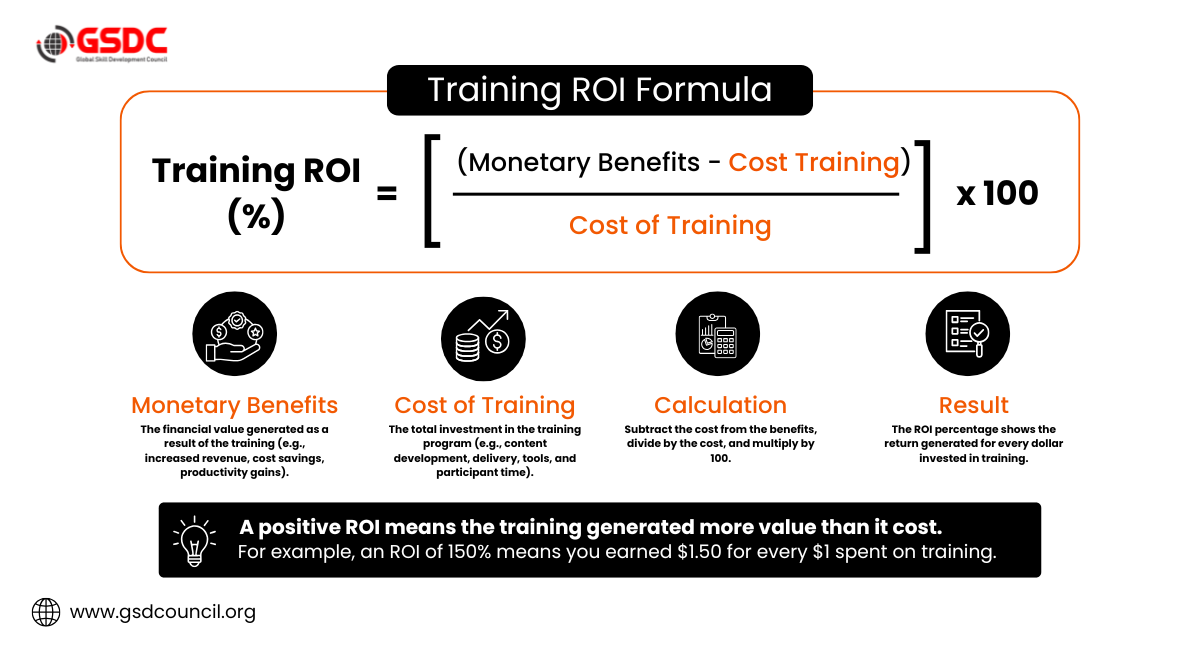
Here's how to apply it in four steps:
Define the business outcome before you launch the training.
Are you trying to reduce errors, cut onboarding time, lift sales conversion, or lower turnover? Pick one primary metric.
Calculate the total cost of training.
Include design/development time, trainer or platform fees, employee time away from work, and any technology costs.
Measure the change after training.
Compare a trained group against a control group where possible, or compare pre- and post-training performance on the same metric.
Convert the improvement into dollars.
For example, if a sales training program lifted average deal size by $2,000 per rep across 50 reps, that's $100,000 in benefit to compare against program cost.
These four steps get you a workable ROI number for a single program. If your team wants to build this as a repeatable, organization-wide skill rather than a one-off calculation, a formal credential like the Certified L&D Analytics & Metrics Professional program can help standardize how your team measures and reports on training impact.
A simple illustrative example (how a basic training ROI calculator works, done by hand):
Note: the figures below are a hypothetical walkthrough to show the math, not a real case study.
Item | Amount |
Training cost (design + delivery + employee time) | $40,000 |
Measured productivity/revenue gain | $110,000 |
Net benefit | $70,000 |
Training ROI | 175% |
You don't need expensive software to start - a spreadsheet with these four inputs is enough to get a directionally accurate number. Purpose-built training roi calculator tools simply automate this once you're running many programs at once.
Corporate Training ROI: Different Programs Need Different Math
Not every training program should be measured the same way. Corporate training roi looks very different depending on what the training is actually for.
Security Awareness Training ROI
Security training is one of the easier categories to justify financially, because the "cost of doing nothing" is well documented. IBM's Cost of a Data Breach Report has found that organizations investing in employee training see meaningfully lower average breach costs than organizations without it - a figure widely cited in the industry as roughly $260,000 lower per breach. For security awareness training roi, the calculation is really a cost-avoidance model: fewer phishing clicks, fewer credential incidents, and a lower chance of a breach that costs millions. (If this number matters for a board presentation, pull the exact figure from IBM's current report rather than a secondary source.)
Compliance Training ROI
Compliance training roi is trickier because "success" is often the absence of a bad event - a fine, a lawsuit, a regulatory finding. The best approach is to track leading indicators (audit findings, policy violations, near-misses) rather than waiting for a major incident to prove the training was worth it.
ROI of Employee Training (General Skills)
For broader skills programs, the roi of employee training usually shows up in three places: faster time-to-competency for new hires, higher internal promotion rates, and lower voluntary turnover. Turnover in particular is worth watching closely - replacing an employee is commonly estimated to cost several months of their salary in recruiting, onboarding, and lost productivity, which makes retention one of the most persuasive ROI arguments L&D teams have.
Across the programs we've reviewed at the Global Skill Development Council (GSDC), this is the pattern that holds up regardless of category: security, compliance, and general skills training all get easier to justify once the metric is picked before the program launches, not after someone asks for a number.
Learning Analytics and AI in Learning and Development
Once an organization starts measuring ROI consistently on individual programs, the next challenge is doing it at scale, across every course and cohort at once. That's where learning analytics platforms and AI come in.
A useful way to think about where your organization stands is a simple five-stage maturity model:
Stage | What You're Measuring | What It Tells You |
1. Basic Reporting | Completions, test scores | Training was delivered |
2. Engagement Tracking | Logins, session time | People showed up |
3. Skills & Outcomes | Competency attainment | People can do the thing |
4. Predictive Analytics | Dropout/risk forecasting | Who needs help, before they fail |
5. Strategic Business Impact | Correlation with productivity, retention, revenue | Training moved the business |
Most organizations sit somewhere around Stage 1 or 2. Very few reach Stage 5, where learning data is actually integrated with HR and performance systems to prove cause and effect.
This is also where AI in learning and development is changing the game. AI-driven systems can flag at-risk learners before they disengage, personalize content based on real performance gaps, and turn dense dashboards into plain-language summaries executives can actually use. Vendor case studies in this space (D2L is one example) report double-digit gains in outcomes like customer satisfaction scores when manager-coaching modules are tracked against integrated performance data - the kind of correlation that's difficult to spot without connected learning analytics. Treat individual vendor case studies as illustrative rather than universal, and look for the underlying methodology before quoting a specific number externally.
Building an L&D Strategy Around ROI
None of this works as a one-time report. It has to be built into how your team plans training in the first place. A strong learning and development strategy starts with the business goal, not the course catalog:
Start with the KPI, not the content.
Ask "what business metric are we trying to move?" before deciding what training to build.
Set a baseline before you train anyone.
You can't prove improvement without knowing your starting point.
Pick one primary metric per program.
Trying to prove everything at once usually proves nothing.
Report in business language.
Translate learning and development metrics into dollars, retention percentages, or error reduction - the language your leadership team already speaks.
Review quarterly, not annually.
L&D roi conversations lose credibility if they only happen once a year, long after budget decisions are already made.
Get this right, and the conversation about roi on learning and development flips. Instead of defending the training budget every quarter, L&D becomes the team leadership actually asks for a growth plan.
Build This as a Career Skill: Certified L&D Analytics & Metrics Professional
Everything in this blog- the ROI formula, the Kirkpatrick and Phillips frameworks, the maturity model is learnable as a structured discipline, not just a one-off exercise for your next budget review.
The Global Skill Development Council (GSDC) offers the Certified L&D Analytics & Metrics Professional program for practitioners who want to move beyond ad-hoc reporting and build measurement into how they design and run training year-round. It covers designing programs with measurable outcomes from day one, applying the Kirkpatrick and Phillips ROI models to real training data, and using learning analytics and AI-driven tools to report outcomes in language leadership trusts.
For L&D managers and HR analytics professionals, that kind of credential is often the difference between justifying a budget every quarter and being the team leadership brings in to plan the next one.

Conclusion
Training used to be judged by how many people showed up. Proving that it's now judged by what changed afterward doesn't require a data science team - it requires picking the right metric before the program launches, pricing the cost honestly, and reporting the result in numbers your leadership team already trusts: dollars, retention, error rates, revenue.
Whether you're measuring corporate training roi on a single onboarding program or building learning analytics into your entire learning and development strategy, the organizations that get this right stop defending their training budgets every quarter and start being the team leadership turns to for growth. Those are also the organizations that keep their learning budgets intact even when the rest of the business is cutting costs.

Related Certifications
Frequently Asked Questions
There's no universal benchmark, since it depends heavily on the program type and how benefits are calculated. As a general guide, many organizations treat anything meaningfully above 100% (benefits exceeding costs) as a strong result, but the more useful comparison is against your own prior programs and industry peers in your sector.
Use the formula: (Monetary Benefits − Cost of Training) / Cost of Training × 100. The hardest part isn't the math - it's isolating the training's effect from other factors influencing the outcome, which is exactly what the Phillips ROI Methodology is designed to help with.
A mix of leading and lagging indicators: completion and competency attainment (leading), plus behavior change, productivity, retention, and error rates (lagging). Avoid relying on any single metric, especially completion rate alone.
A four-level framework for evaluating training: reaction, learning, behavior, and results. It's the most widely used starting point for training evaluation and pairs well with the Phillips ROI Methodology for organizations that want to go a step further and express results in financial terms.
Yes, though indirectly. Since the goal of compliance training is often to prevent an event rather than create a measurable gain, track leading indicators like audit findings and policy violations rather than waiting for an incident to prove the program's value.
Stay up-to-date with the latest news, trends, and resources in GSDC
If you like this read then make sure to check out our previous blogs: Cracking Onboarding Challenges: Fresher Success Unveiled
Not sure which certification to pursue? Our advisors will help you decide!