How to Use Learning Analytics to Improve Training Outcomes

Written by Matthew Hale
- What Is Learning Analytics? (A Simple Definition)
- Why Training Metrics Actually Matter
- Learning Analytics for Assessment: Beyond the Final Quiz
- Training ROI: How to Actually Calculate It
- Learning Analytics Tools, Software, and Platforms: What to Look For
- Building a Corporate Learning Analytics Practice: Where to Start
- The Skills L&D Teams Need for This Shift
- Ready to Build These Skills Yourself?
- Closing Thoughts
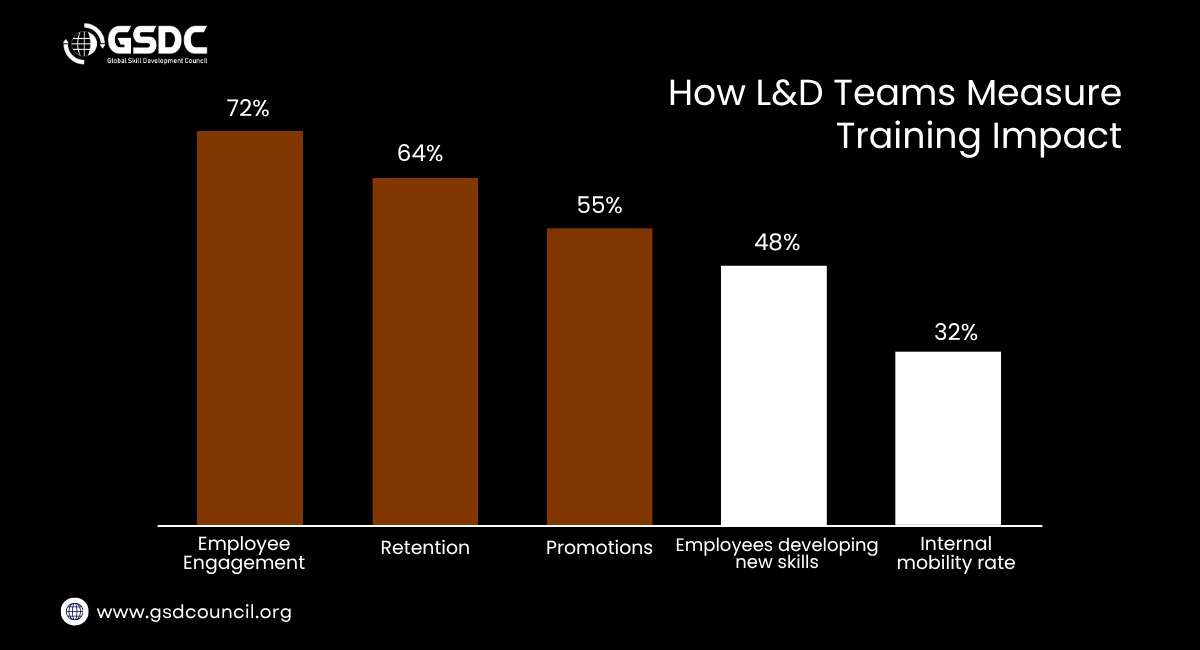
Most training programs are still run on gut feeling. A course gets launched, people click through it, a completion certificate is issued, and then everyone moves on without really knowing if anything changed. Here's the telling part: LinkedIn's 2025 Workplace Learning Report found that even among the most mature organisations (the ones it calls "career development champions"), 72% measure impact through employee engagement and 64% through retention, but only 48% actually track whether employees developed new skills. In other words, most L&D teams are measuring how people feel about training far more often than what it actually changed.
This is exactly the gap that learning analytics is built to close. Instead of guessing whether a course "worked," learning analytics lets L&D teams track how people actually learn, where they get stuck, and whether the training shows up later as better performance on the job. For L&D teams, that's a meaningful shift in how training effectiveness can be demonstrated.
In this blog, we'll break down what learning analytics really means, the training metrics that matter, how to measure training ROI properly, and the tools and skills you'll need to make data part of how your L&D function operates, not just something you report on once a quarter.
What Is Learning Analytics? (A Simple Definition)
If you search "what is learning analytics," most definitions sound more complicated than the idea actually is.
Learning analytics definition:
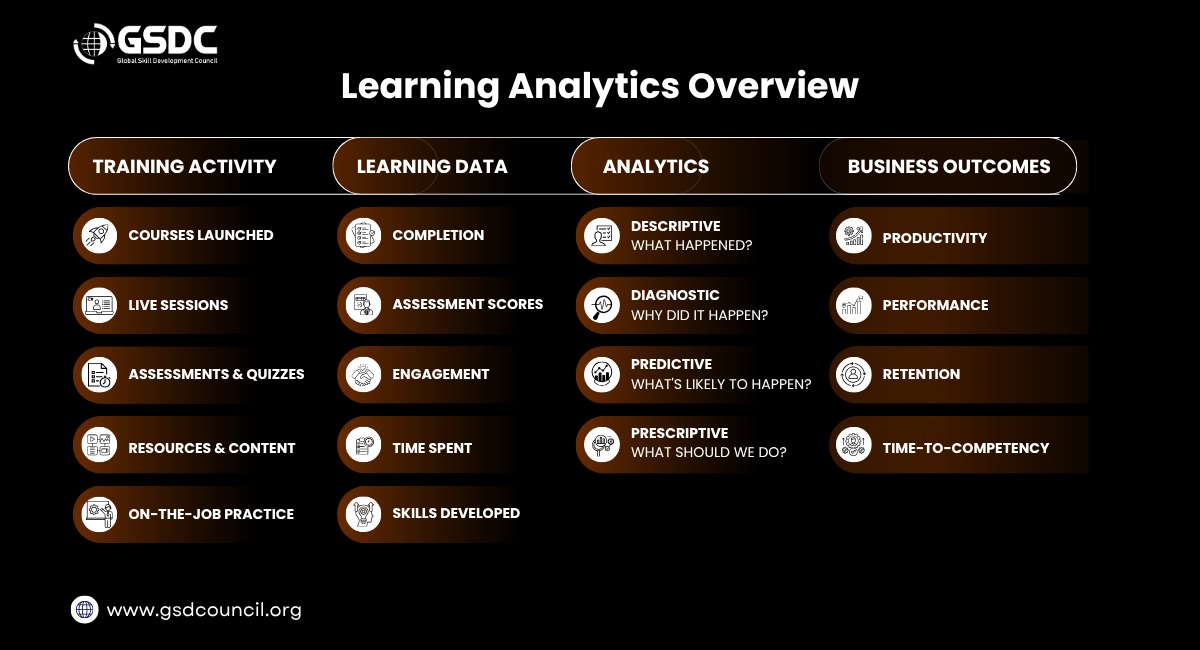
Learning analytics is the practice of collecting, measuring, and analysing data about learners and their learning environments, including course engagement, quiz scores, time-on-task, completion patterns, and post-training performance, in order to understand and improve both the learning experience and business outcomes.
In plain terms: it's the difference between "87% of people finished the course" and "imagine finding that the people who finished the course started closing deals faster than those who didn't." The first is a completion metric. The second, if you could actually trace it, is a business insight. Learning analytics is the practice that lets you go looking for connections like that instead of stopping at the completion number.
Learning Analytics in Practice:
A company launches a sales training program. Completion sits at a healthy 91%, on paper a success. But learning analytics digs deeper: learners who struggled with the objection-handling module also show lower post-training conversion rates. Instead of stopping at the completion number, the L&D team introduces a short, targeted practice module on objection-handling and compares conversion rates before and after. That's learning analytics doing its job: turning a completion stat into a specific, actionable fix.
Types of Learning Analytics
Not all learning analytics answer the same question. There are generally four types of learning analytics, and each one plays a different role in how L&D teams make decisions:
Type | What It Answers | Example |
Descriptive analytics | What happened? | Completion rates, quiz scores, login frequency |
Diagnostic analytics | Why did it happen? | Which module caused drop-offs; where scores dipped |
Predictive learning analytics | What's likely to happen next? | Flagging employees at risk of failing certification or disengaging |
Prescriptive analytics | What should we do about it? | Recommending a refresher module or a different learning path |
Descriptive analytics is usually the easiest starting point, since the data is simple to collect. The bigger payoff comes with prediction: spotting learners at risk of disengaging before it becomes a performance problem. Moving comfortably across all four types is exactly the kind of applied skill the Certified L&D Analytics & Metrics Professional program is built to develop.
Why Training Metrics Actually Matter
L&D has historically leaned on "vanity metrics": enrolments, hours logged, satisfaction scores. These aren't useless, but they don't tell you whether behaviour changed. Good training metrics measure the transfer of learning into real work.
Here's how that gap plays out in practice: as the LinkedIn data above shows, even top-performing organisations lean heavily on engagement and retention as proxies for training success, while far fewer directly track new skills developed or internal mobility, outcomes that can provide stronger evidence of whether learning is translating into workplace capability. Engagement and retention aren't wrong to track; they're just not enough on their own. That's the core problem with vanity metrics: they tell you people showed up, not that anything moved.
Some corporate training metrics worth tracking instead of (or alongside) completion rates:
- Time-to-competency: how long it takes a new hire or learner to hit performance targets
- Knowledge retention: scores on spaced follow-up assessments, not just the end-of-course quiz
- Behaviour change: measured through manager observation, performance data, or on-the-job assessments
- Employee training metrics tied to outcomes: error rates, productivity, quality scores, or customer satisfaction before vs. after training
- Engagement depth: not just "did they log in," but how they interacted with content
- Retention and internal mobility: whether trained employees stay longer or get promoted faster
According to LinkedIn's 2025 Workplace Learning Report, here's how the most mature L&D organisations actually measure business impact today:
How Impact Is Measured | % of Top-Performing Organisations Using It |
Employee engagement | 72% |
Retention | 64% |
Promotions | 55% |
Employees developing new skills | 48% |
Internal mobility rate | 32% |
Notice the drop-off: engagement and retention are easy to track and widely used, but the metrics that more directly point to skill growth, new skills developed, and internal mobility are used by fewer than half of even the top-performing organisations. That gap is precisely where a stronger learning analytics practice adds the most value.
Learning Analytics for Assessment: Beyond the Final Quiz
Assessment used to mean one thing: a quiz at the end of a module. Learning analytics for assessment expands that into something much more useful: continuous, low-stakes signals collected throughout the learning journey.
That can include:
- Pattern recognition: which questions or topics trip up most learners, pointing to gaps in the content itself, not just the learner
- Adaptive testing: difficulty adjusts in real time based on how a learner is performing
- Confidence-based assessment: comparing how sure a learner felt about an answer against whether they got it right, which flags overconfidence (a genuine workplace risk in compliance-heavy roles)
- Skill-gap mapping: comparing assessment results against a role's required competencies to build targeted, individual learning paths
Done well, this turns assessment from a pass/fail checkpoint into an ongoing diagnostic tool, more like regular check-ups than a single annual physical. Skill-gap mapping in particular is the same logic behind competency-based certifications, including the ones offered by the Global Skill Development Council (GSDC): assess where someone actually stands against a defined skill set, then build the learning path from there.
Training ROI: How to Actually Calculate It
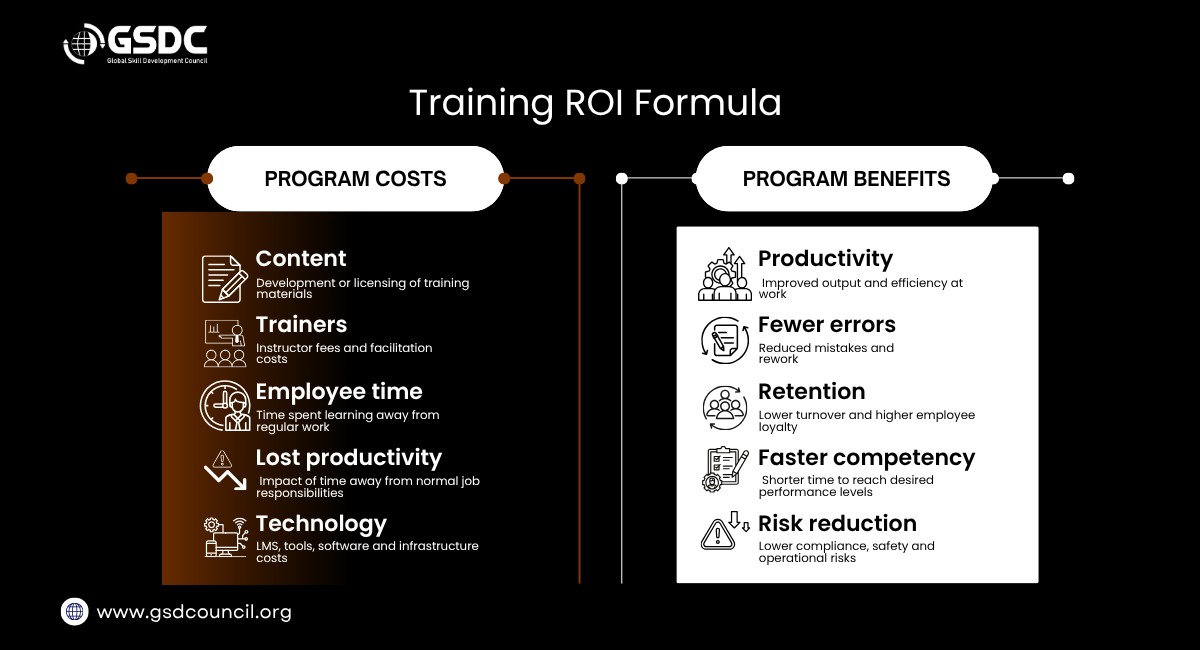
For context on the cost side of that equation: the Association for Talent Development's State of the Industry report put average direct training expenditure at $1,283 per employee. That's the kind of investment leadership expects a return on, and it's exactly why the benefit side of the ROI formula can't rest on completion rates alone. Without a credible measure of benefits, however, you have a spending figure rather than a meaningful ROI calculation.
This is exactly where learning analytics platforms earn their keep: they can pull learner performance data, time-to-competency figures, and post-training outcomes automatically, instead of L&D teams reconstructing all of this by hand every quarter.
Learning Analytics Tools, Software, and Platforms: What to Look For
There's a lot of overlap in terminology here, and vendors don't always use it consistently, so it helps to separate what you're actually shopping for:
Term | What It Usually Means |
Learning analytics system | The underlying infrastructure that collects and stores learner data (often built into an LMS) |
Learning analytics software | The application layer that processes and visualises that data |
Learning analytics platform | A broader ecosystem, often combining LMS, assessment, and reporting into one connected environment |
Learning analytics solution | A packaged offering (software + support + implementation) aimed at solving a specific L&D measurement problem |
Learning analytics tools | Individual point solutions: dashboards, xAPI trackers, survey tools, used alongside a broader system |
In practice, most L&D teams end up combining a few categories rather than relying on one system:
- LMS analytics: built-in reporting from your learning management system (completions, scores, time spent)
- HRIS data: performance, retention, and promotion data from your HR system, connected to learning records
- BI tools: Power BI, Tableau, or similar, for building custom dashboards across data sources
- xAPI/LRS infrastructure: a Learning Record Store that captures granular activity data beyond what a standard LMS reports
- Assessment platforms: dedicated tools for skills testing, certification, and adaptive assessment
When evaluating any of these, a few things separate genuinely useful tools from basic reporting dashboards:
- Integration: Can it pull data from your LMS, HRIS, and performance systems, or does it live in a silo?
- Real-time reporting: Are you seeing this week's engagement, or last quarter's?
- Predictive capability: Can it flag risk before someone fails, not just report on it after?
- A usable learning and development metrics dashboard: one that a manager (not just an L&D analyst) can actually read and act on
- Privacy and governance: learner data is sensitive; the platform should be transparent about what's tracked and why
Building a Corporate Learning Analytics Practice: Where to Start
You don't need a fully built-out analytics team to start. A practical rollout usually looks like this:
- Define what "success" means before you launch. Pick 2 to 3 business outcomes the training should influence, not just "engagement."
- Set a baseline. You can't prove improvement without knowing where you started.
- Pick one or two training metrics to track consistently, rather than trying to measure everything at once.
- Connect learning data to business data: sales numbers, error rates, retention, even if that connection starts as a manual spreadsheet.
- Review and adjust quarterly. Corporate learning analytics is only useful if it changes what you do next, not just what you report.
The Skills L&D Teams Need for This Shift
As training decisions become more data-driven, L&D skills are shifting too. Beyond instructional design, teams increasingly need people comfortable with reading a training dashboard, basic statistics (correlation vs. causation matters here), data storytelling, and xAPI/SCORM standards.
Many L&D specialist job description postings now combine analytics literacy with facilitation and content skills. For L&D analyst jobs, dashboard experience (Power BI, Tableau, or native LMS analytics) is increasingly valuable.
On compensation: the U.S. Bureau of Labor Statistics reports a median annual wage of $69,280 for training and development specialists, rising to a median of $127,090 for training and development managers. Analytics skills are increasingly part of what separates the two.
Ready to Build These Skills Yourself?
Knowing what learning analytics can do is one thing; being able to run the analysis, build the dashboard, and defend the ROI is another. GSDC's Certified L&D Analytics & Metrics Professional program builds exactly that: practical skills across descriptive, diagnostic, predictive, and prescriptive analytics, plus training ROI modelling and data storytelling for real L&D roles.

Closing Thoughts
Learning analytics isn't about turning L&D into a data science department. It's about answering one question with confidence: did this training work, and how do we know? Engagement and retention are a reasonable starting point, but they're not a finish line, the metrics worth building toward, like skills developed and time-to-competency, are the ones fewer teams currently track.
Start small: one or two consistent metrics, tied to a business outcome, reviewed quarterly. That's enough to stop defending training budgets with opinions and start defending them with evidence.

Related Certifications
Frequently Asked Questions
It's the use of learner data, including engagement, assessment results, and performance outcomes, to measure and improve the effectiveness of training.
Training metrics are the individual data points (completion rate, quiz score, time spent). Learning analytics is the broader practice of collecting, connecting, and interpreting those metrics to guide decisions.
No. Even small L&D teams can start with simple predictive signals, like flagging low engagement in the first week of a course, which can be used as an early signal for potential disengagement or dropout.
Evaluation is the process (surveys, tests, observation); effectiveness measurement is the outcome, whether the training actually produced the intended change in performance.
Stay up-to-date with the latest news, trends, and resources in GSDC
If you like this read then make sure to check out our previous blogs: Cracking Onboarding Challenges: Fresher Success Unveiled
Not sure which certification to pursue? Our advisors will help you decide!